Usage
This usage guide is for explorers 🔎, researchers 🧪, and developers 💻 learning how to use AmoebotSim’s front-end user interface.
At A Glance
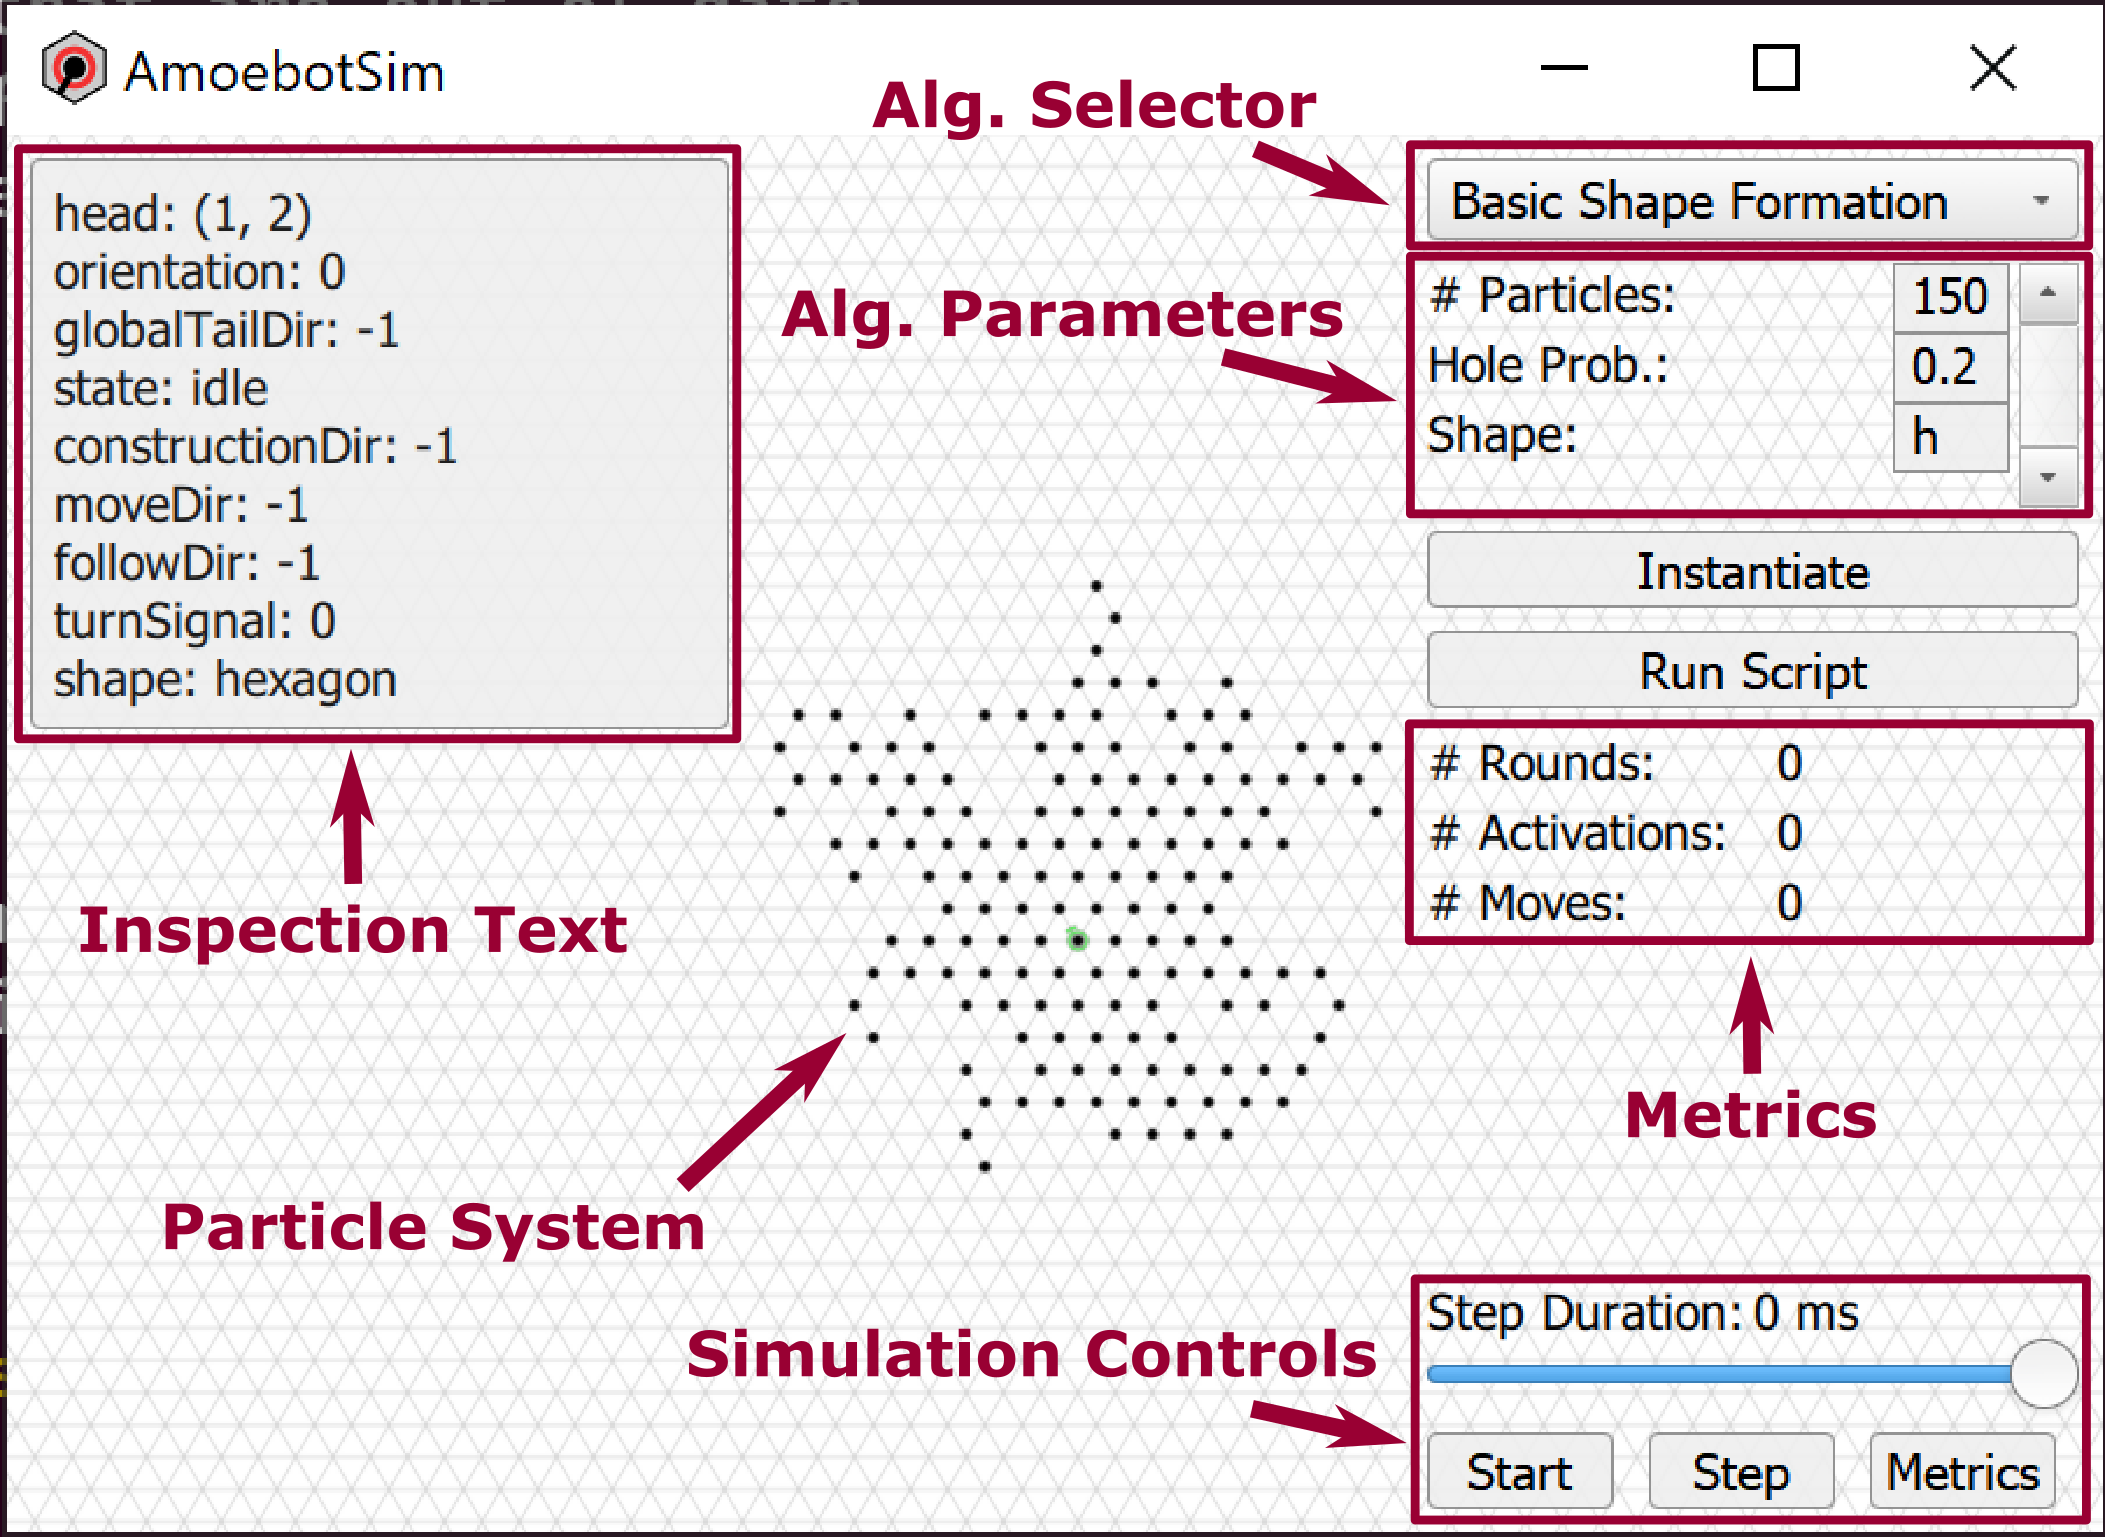
As a first introduction to AmoebotSim, we’ll discuss the main parts of its interface:
Particle System. The black dots represent individual particles, which can optionally display a color and a directional pointer. They live on the nodes of the triangular lattice (grey lines).
Algorithm Selector and Parameters. Choose the algorithm you want to simulate from the dropdown menu, and add its parameters in the list. Pressing Instantiate will generate a new instance of that algorithm with the specified parameters.
Simulation Controls. Pressing the Start/Stop button will start and stop the instanced simulation. When stopped, the Step button will execute a single particle activation. The Step Duration slider controls how fast the simulation proceeds.
Metrics. These labels track different simulation statistics as it runs.
Inspection Text. A particle’s inspection text shows various information about its state.
Controls
Left-click and drag to translate the scene, and use the scroll wheel to zoom in and out. Interact with individual particles by using the following.
Windows |
macOS |
The selected particle… |
|---|---|---|
|
|
…executes a single activation |
|
|
…shows its inspection text |
The following keyboard shortcuts are also available.
Windows |
macOS |
Description |
|---|---|---|
|
|
Start/stop the current simulation |
|
|
Execute a single particle activation |
|
|
Focus the scene on the particle system |
|
|
Hide/show UI elements (useful for presentations) |
|
|
Export metrics data as JSON |
Exporting Metrics Data
AmoebotSim supports metrics tracking for its algorithms. These metrics can be simple, such as the cumulative number of moves made by particles, or more complicated, such as the distance between the furthest pair of particles or the perimeter of a connected particle system. AmoebotSim automatically tracks these metrics and stores their historical data, which can be exported as a JSON for further analysis or plotting. Exporting metrics data (using either the Metrics button or Ctrl+E/Cmd+E) writes the metrics file as metrics/metrics_<secs_since_epoch>.json to the application executable’s directory. The structure of these JSON files is:
{
  "title" : "AmoebotSim Metrics JSON",
  "datetime" : str,
  "algorithm" : str,
  "counts" : [count],
  "measures" : [measure]
}

count : {
  "name" : str,
  "history" : [int]
}

measure : {
  "name" : str,
  "frequency" : int,
  "history" : [float]
}
Details on implementing custom metrics and attaching them to algorithms can be found in the MetricsDemo tutorial.